
Link monitors
What this screen is for
A broken affiliate link is broken income — and you usually find out when your dashboard goes quiet, not when the link actually broke. A link monitor watches one of your links, from one country, on a schedule. Every check fetches the page and compares it against the previous check. If the page starts returning an error, gets blocked, or the offer on it changes, Routy tells you.
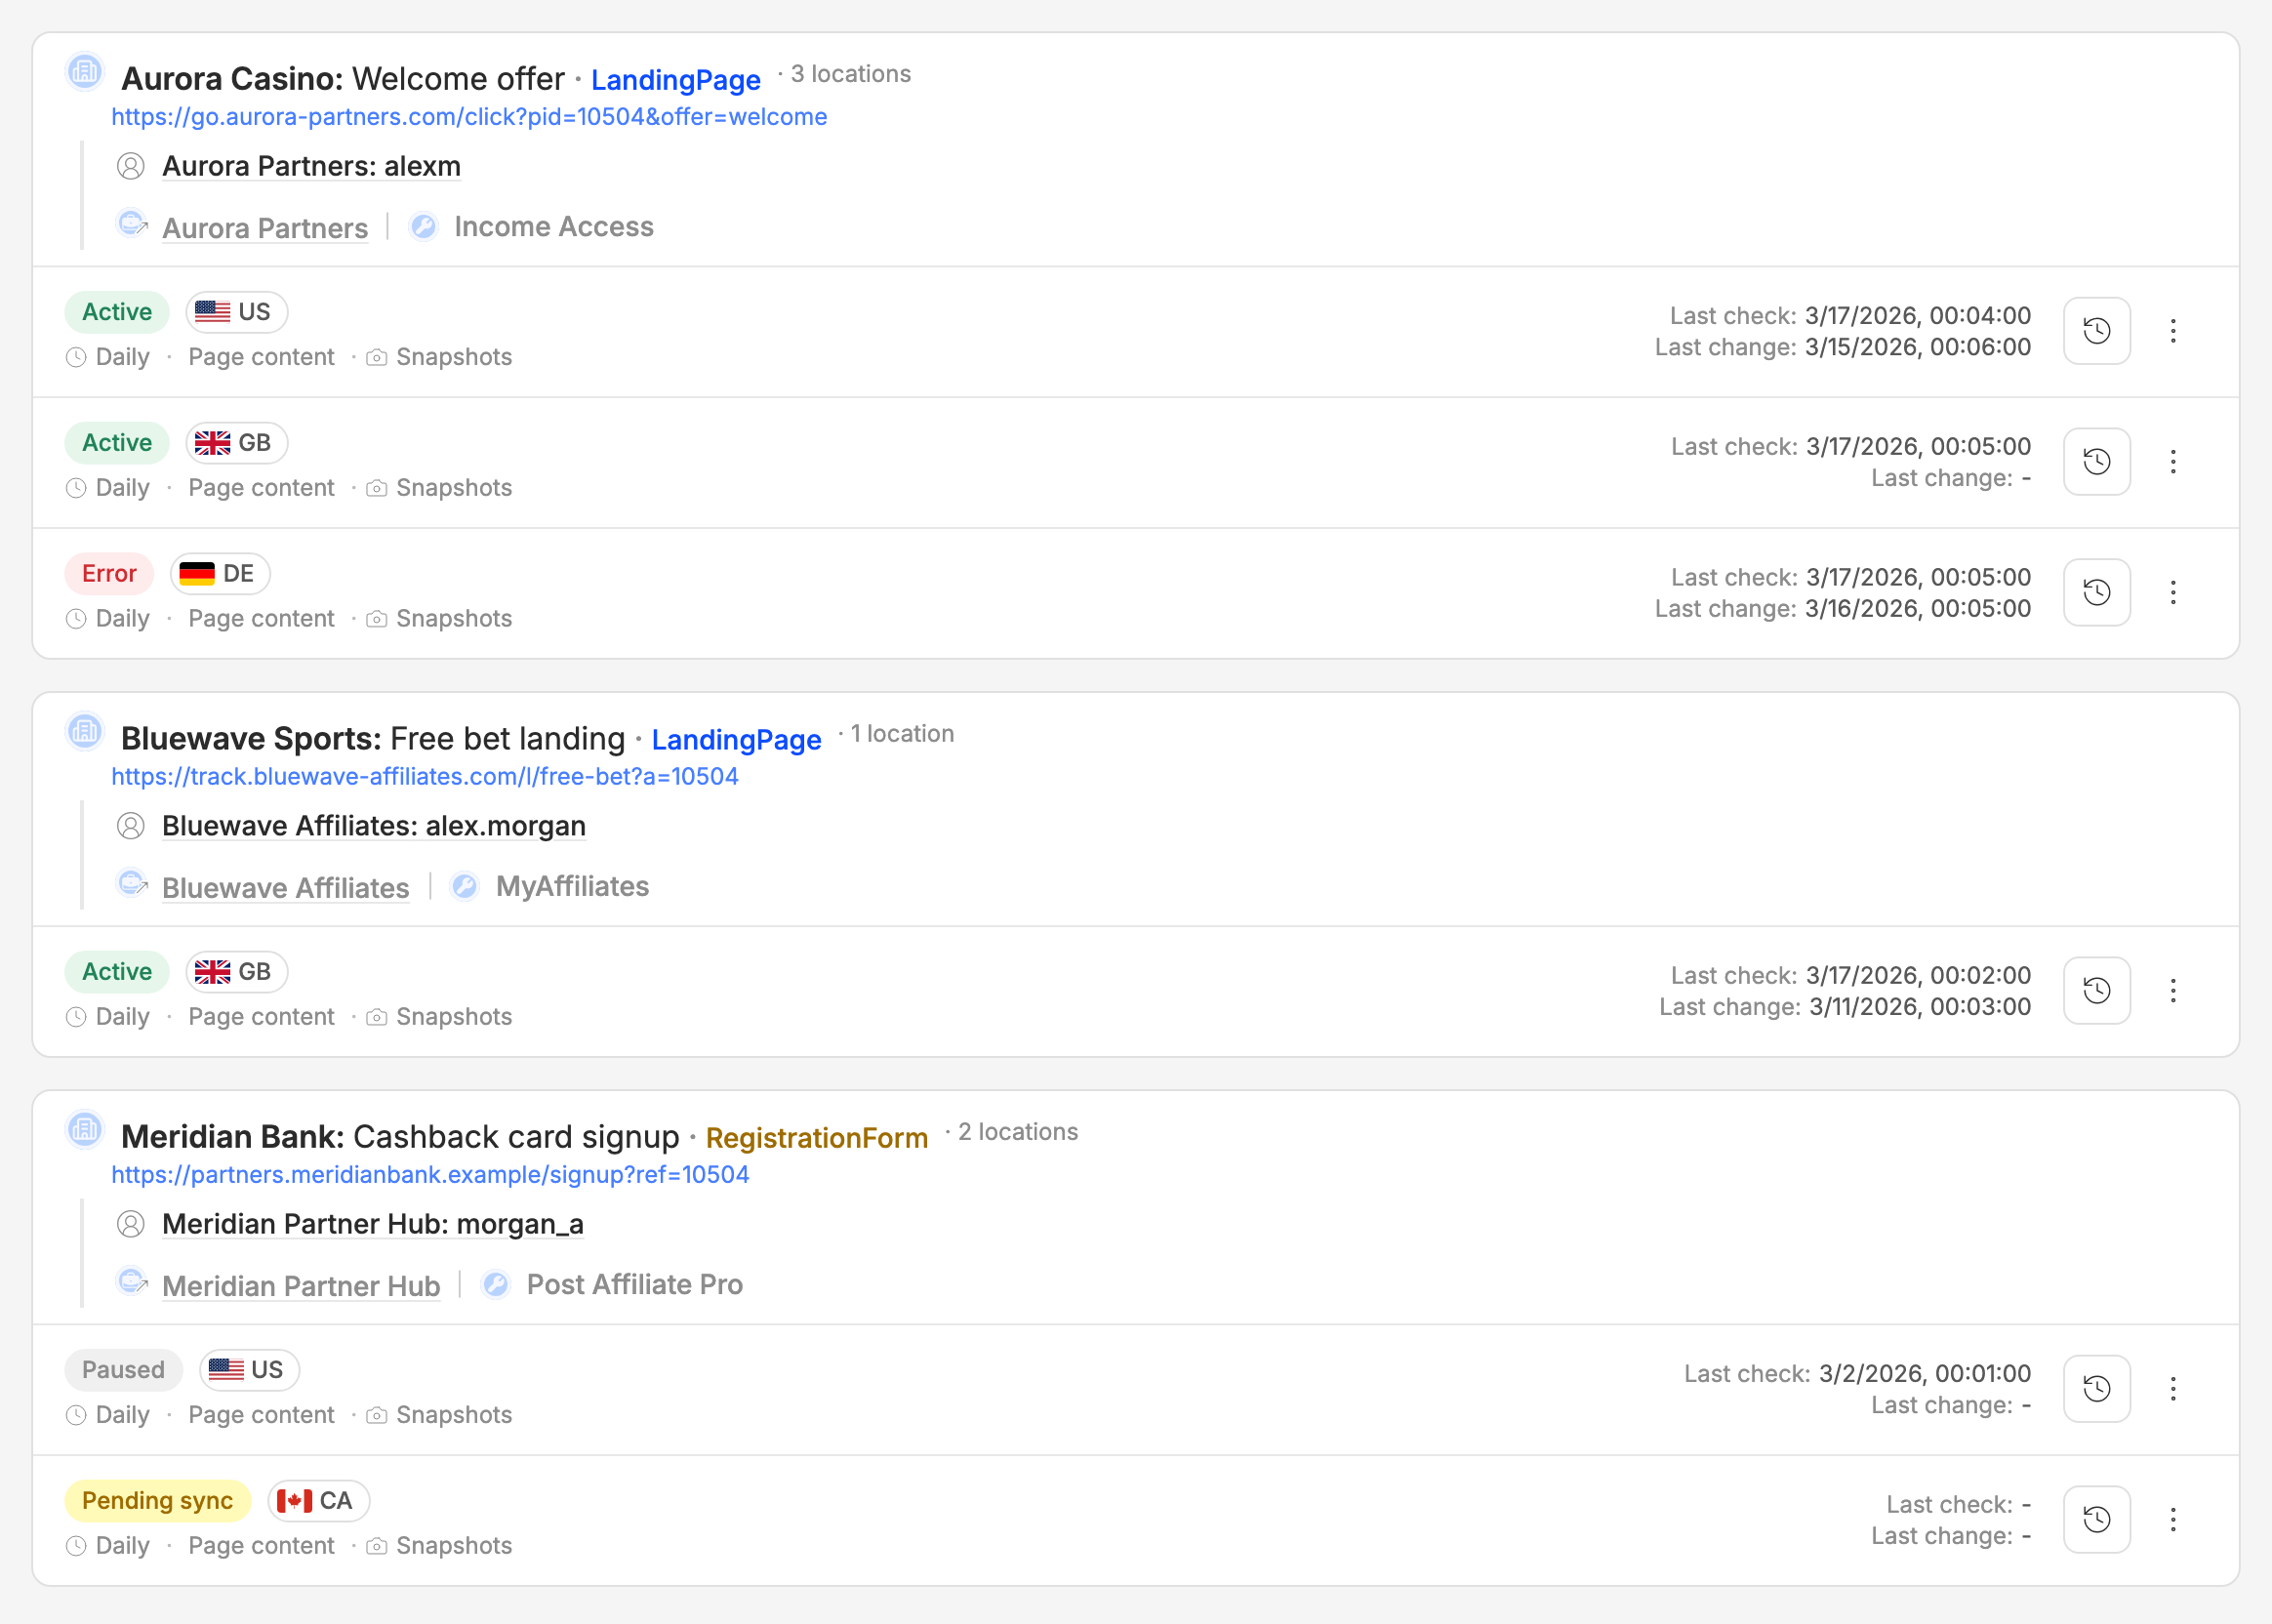
Monitors are grouped by the link they watch. The example above shows the Aurora welcome offer watched from three countries: the US and UK checks are healthy and the German one is failing — which is exactly the situation a single check from a single country would have hidden from you.
Adding a monitor
You always monitor one of your existing links — you don't type a URL.
The quickest route is from Routy Links, where every link carries a Monitor column: a status badge if the link is already watched, and an Add monitor button if it isn't.
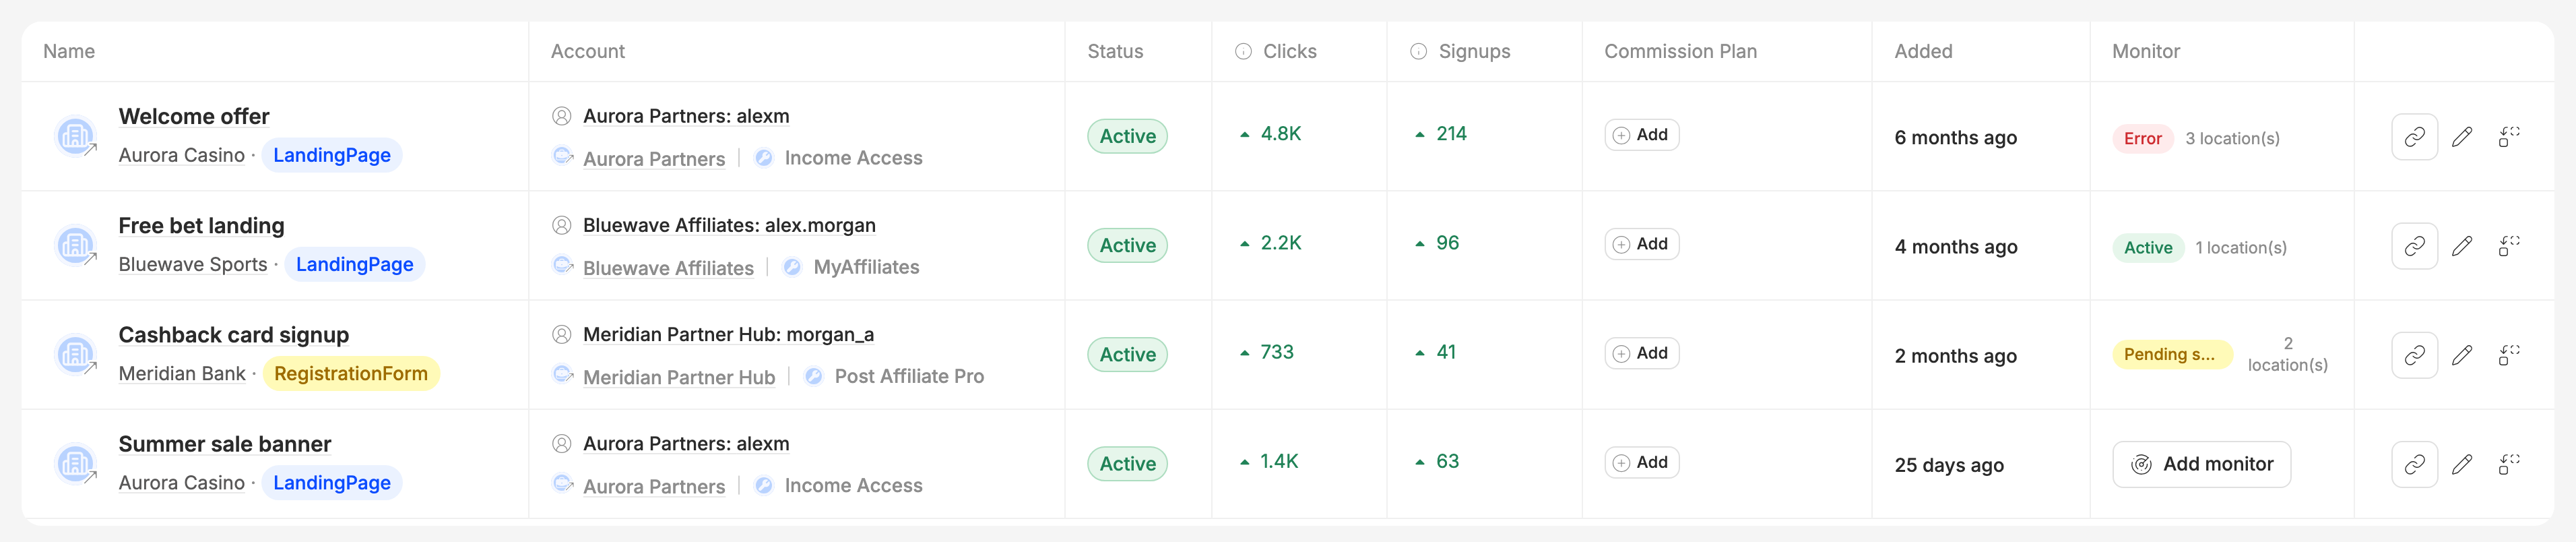
You can also open the Link monitors page (the button at the top of Routy Links) and click Add monitor there, then pick a link from the list.
Either way you fill in the same short form:
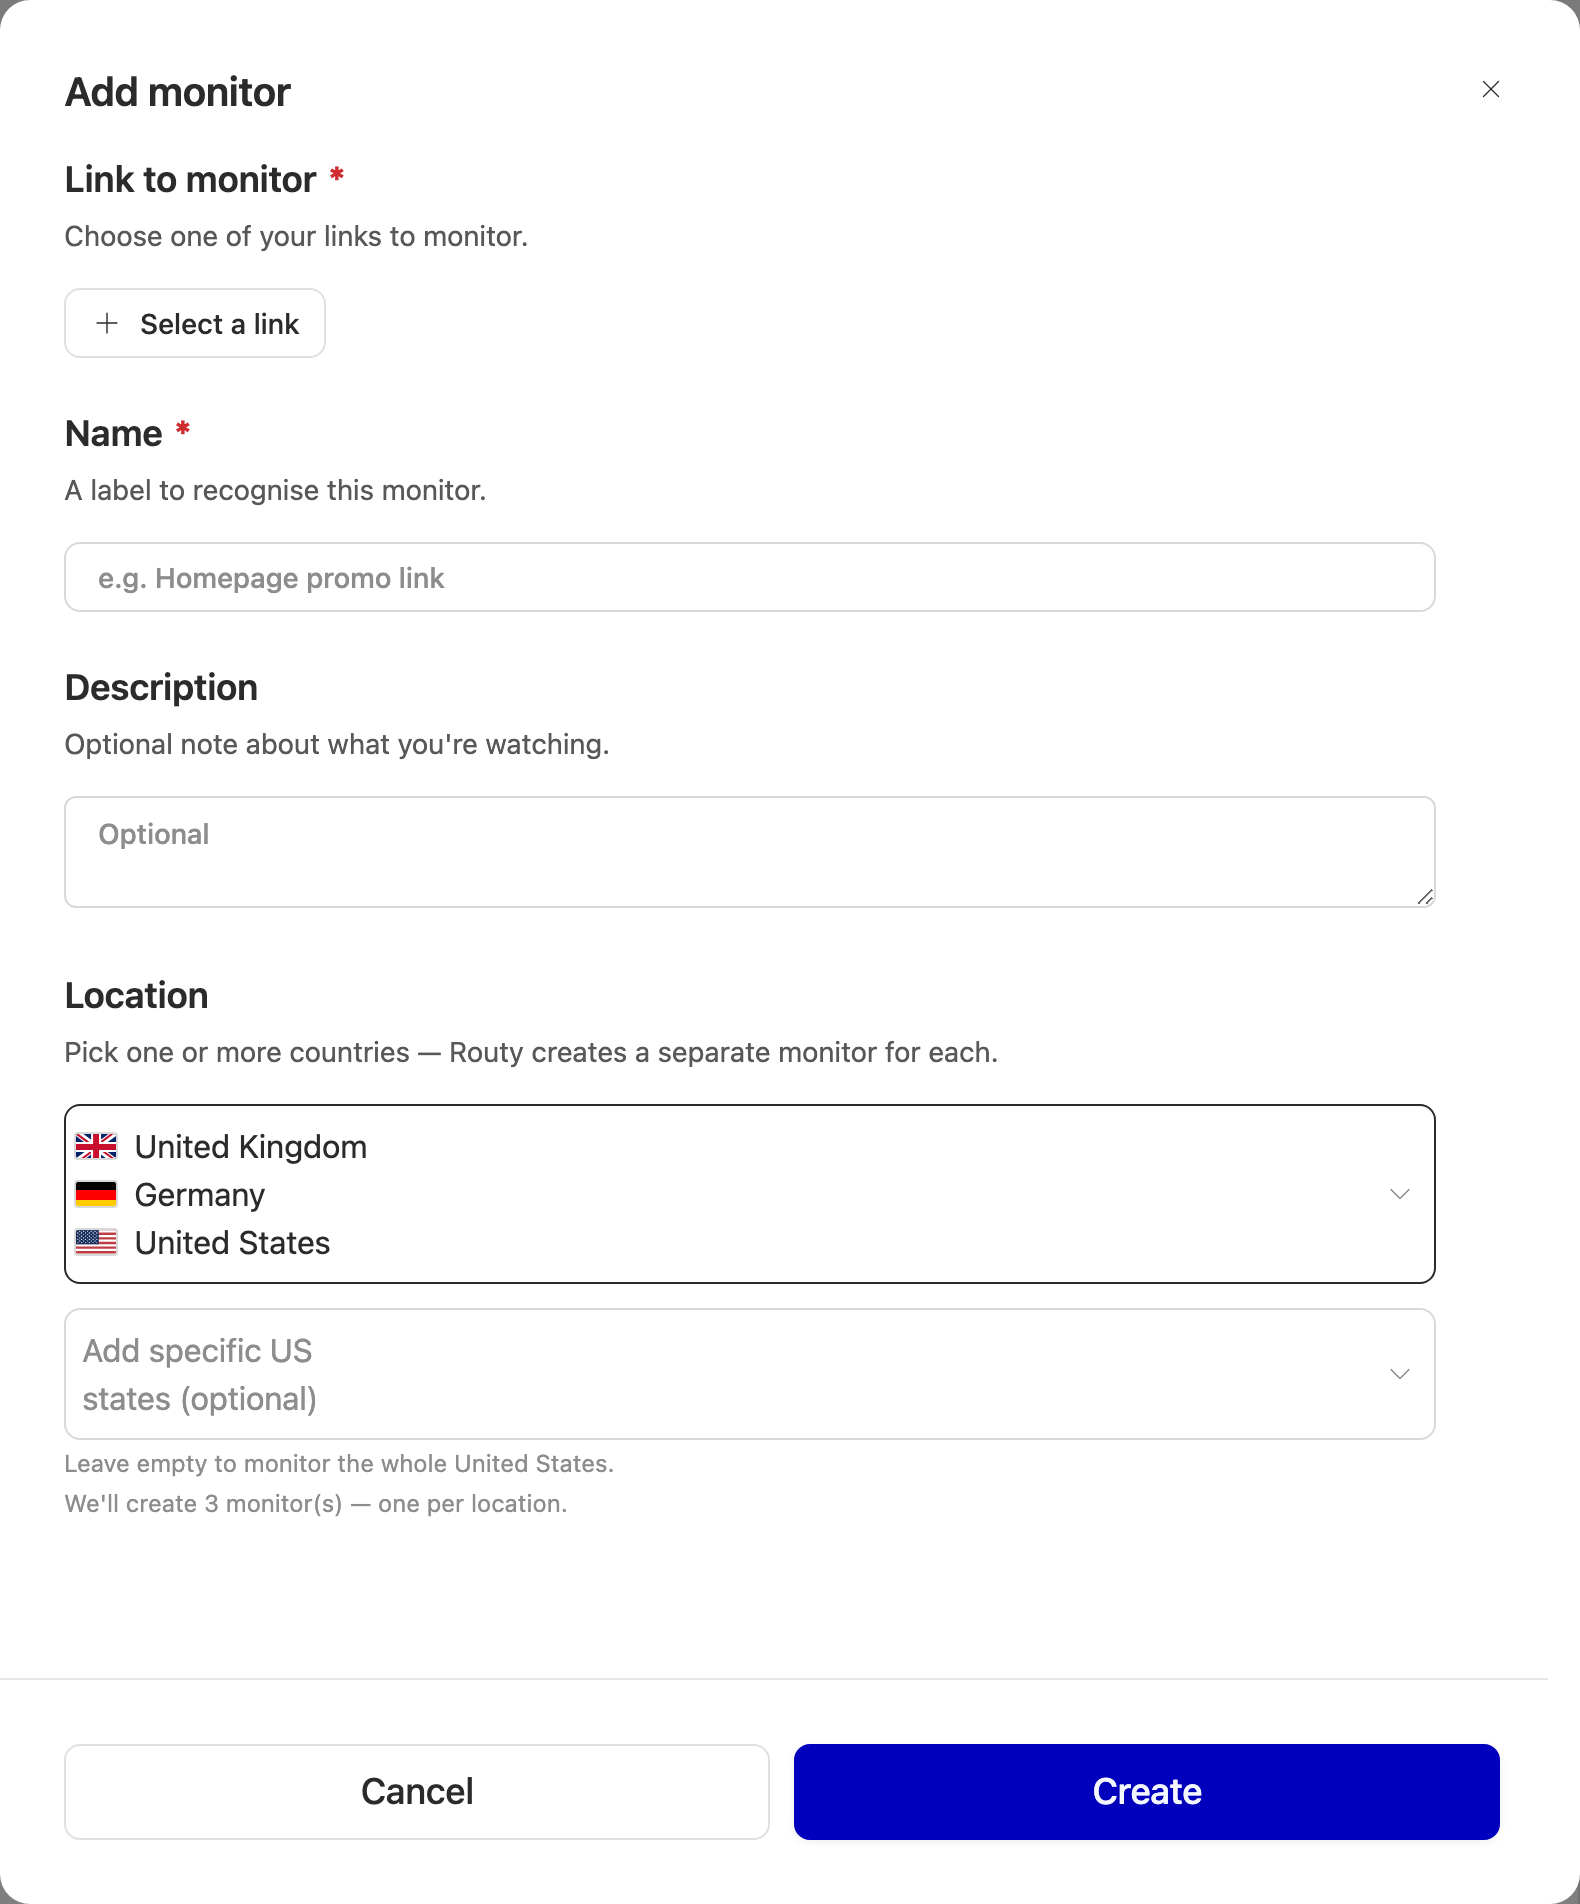
- Link to monitor — choose one of your links. If you started from the Monitor column the link is already filled in.
- Name — a label you'll recognise. Starting from a link pre-fills a sensible one (program, account, link).
- Description — optional note about what you're watching for.
- Location — one or more countries. See below.
Everything else is set for you: your monitors check daily, compare the page content, and save a screenshot and a copy of the page whenever a change is detected. If you need a different check frequency, your account manager can change it for you.
Location
A monitor runs from exactly one location. When you tick several countries while creating one, Routy creates one monitor per country, all grouped under the same link — the form tells you how many it's about to create.
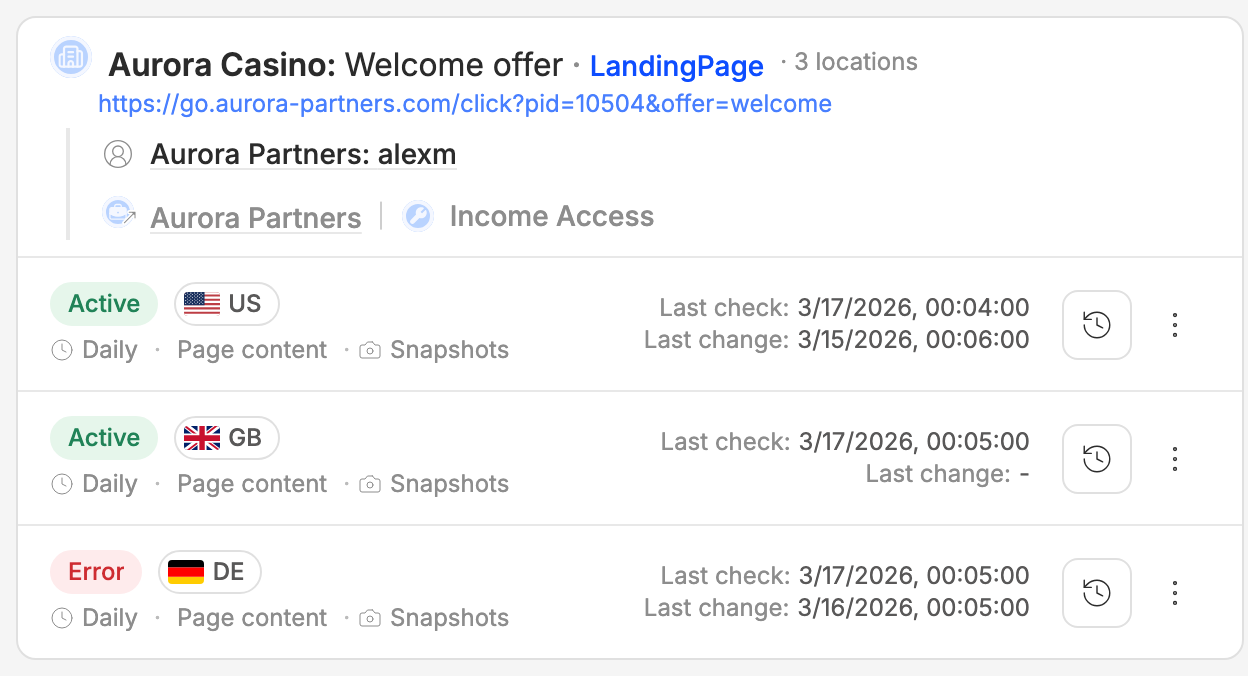
That's deliberate: an offer can be live in the UK and pulled in Germany, and the only way to see that is to check from both. It also means each country counts separately against your plan's monitor limit.
- You can target countries around the world, and — for the United States only — individual states. Leaving the US states field empty watches the United States as a whole.
- Picking no location creates a single monitor that checks from Routy's default location.
- Changing location later: editing a monitor moves it to a different single country. To watch one more country, add another monitor instead.
What a check actually does
Each check loads the page the link resolves to and records:
- the HTTP status it came back with,
- the final URL after all redirects, and
- the text of the page — with cookie and consent banners stripped out first, so a consent popup doesn't register as a change every single day.
The text is compared against the previous check. If it's identical, the check is recorded as No change and nothing else happens.
Not every change is worth an alert
If the text did move, Routy asks an AI reviewer what actually changed and how big a deal it is, and scores it 1–10:
- A promo banner rotating, a countdown ticking, a cosmetic edit — scored low, written into the history with its score, and no alert.
- The offer or its terms changing, the destination changing, or the page being down — always alerted, whatever the score.
So a low score with no notification isn't a missed alarm; it's the filter doing its job — and you can always see the score and the one-line explanation in the history, whether or not it alerted.
Reading the check history
Click the history button on any monitor row to see its checks, newest first.
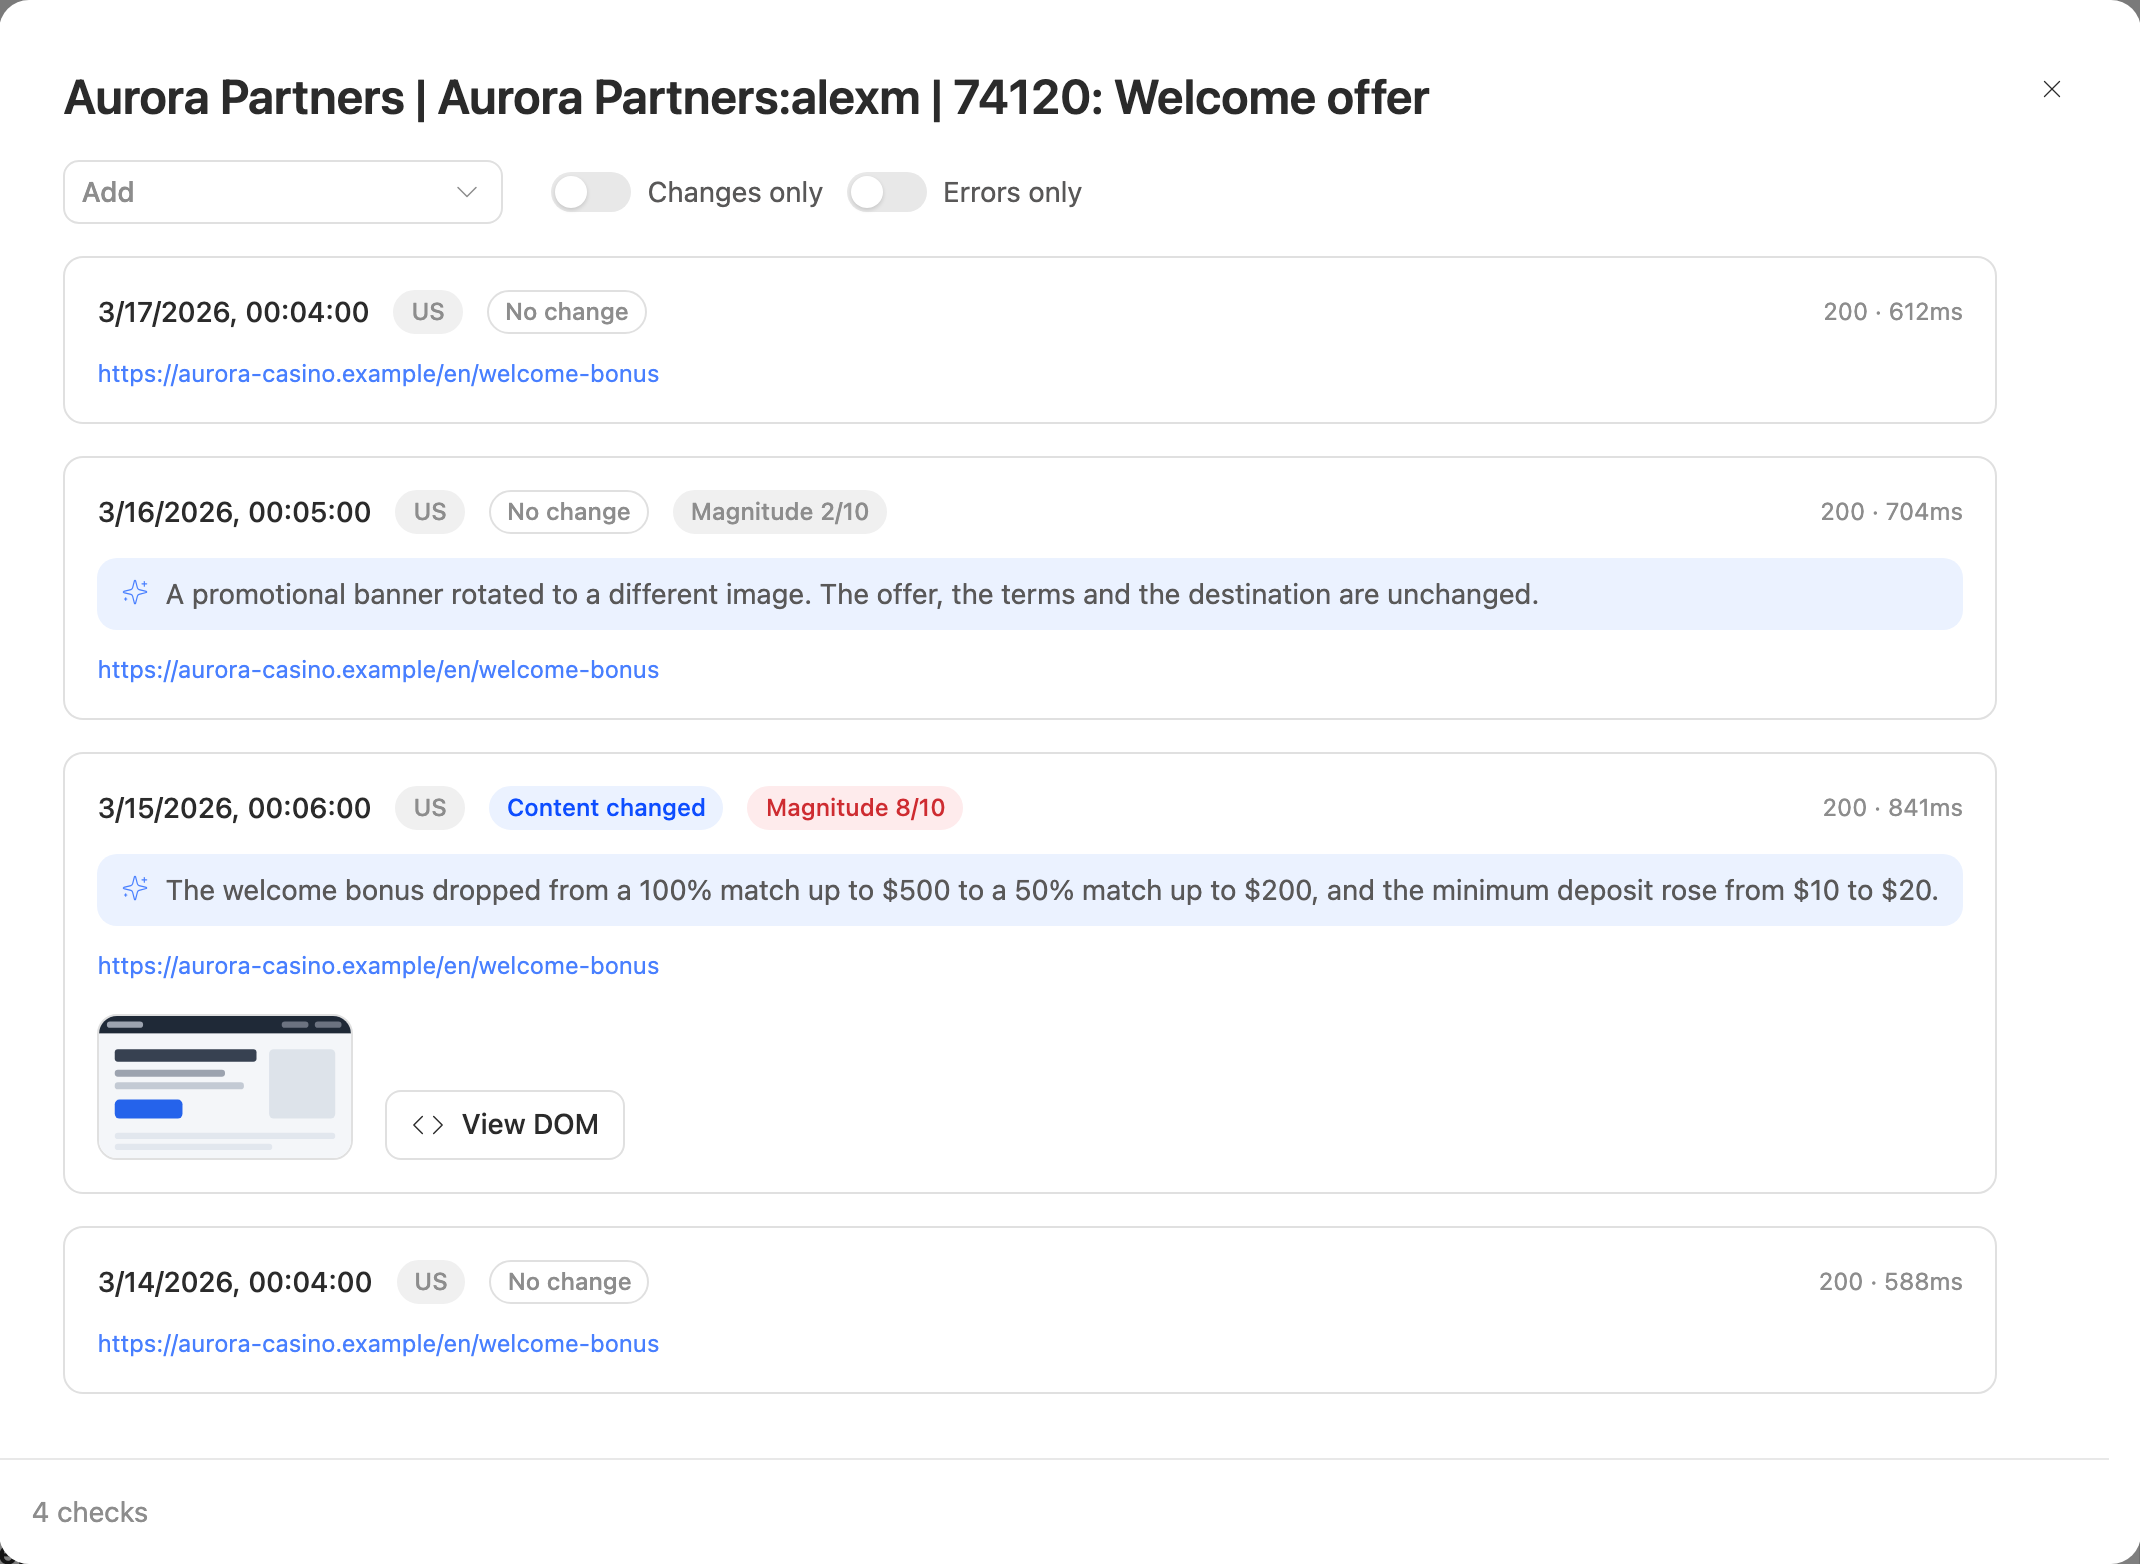
Each check shows:
- When it ran and which location it ran from.
- What happened — No change, a change type (Content changed, URL changed, Status changed, Became unavailable), or Error.
- The magnitude score, when a change was reviewed.
- The AI summary — one line on what changed, in plain language.
- The HTTP status and response time, on the right.
- The final URL the link resolved to.
- A screenshot thumbnail and a View DOM link, when a snapshot was captured for that check.
Use the toggles at the top to show only checks with changes, or only checks with errors.
Two things worth knowing
- Screenshot and DOM links are temporary. They're regenerated every time you open the history, so if you've had the panel open for a long time, close and reopen it to get working links.
- Checks are kept for 30 days. Older ones are removed.
When a link breaks
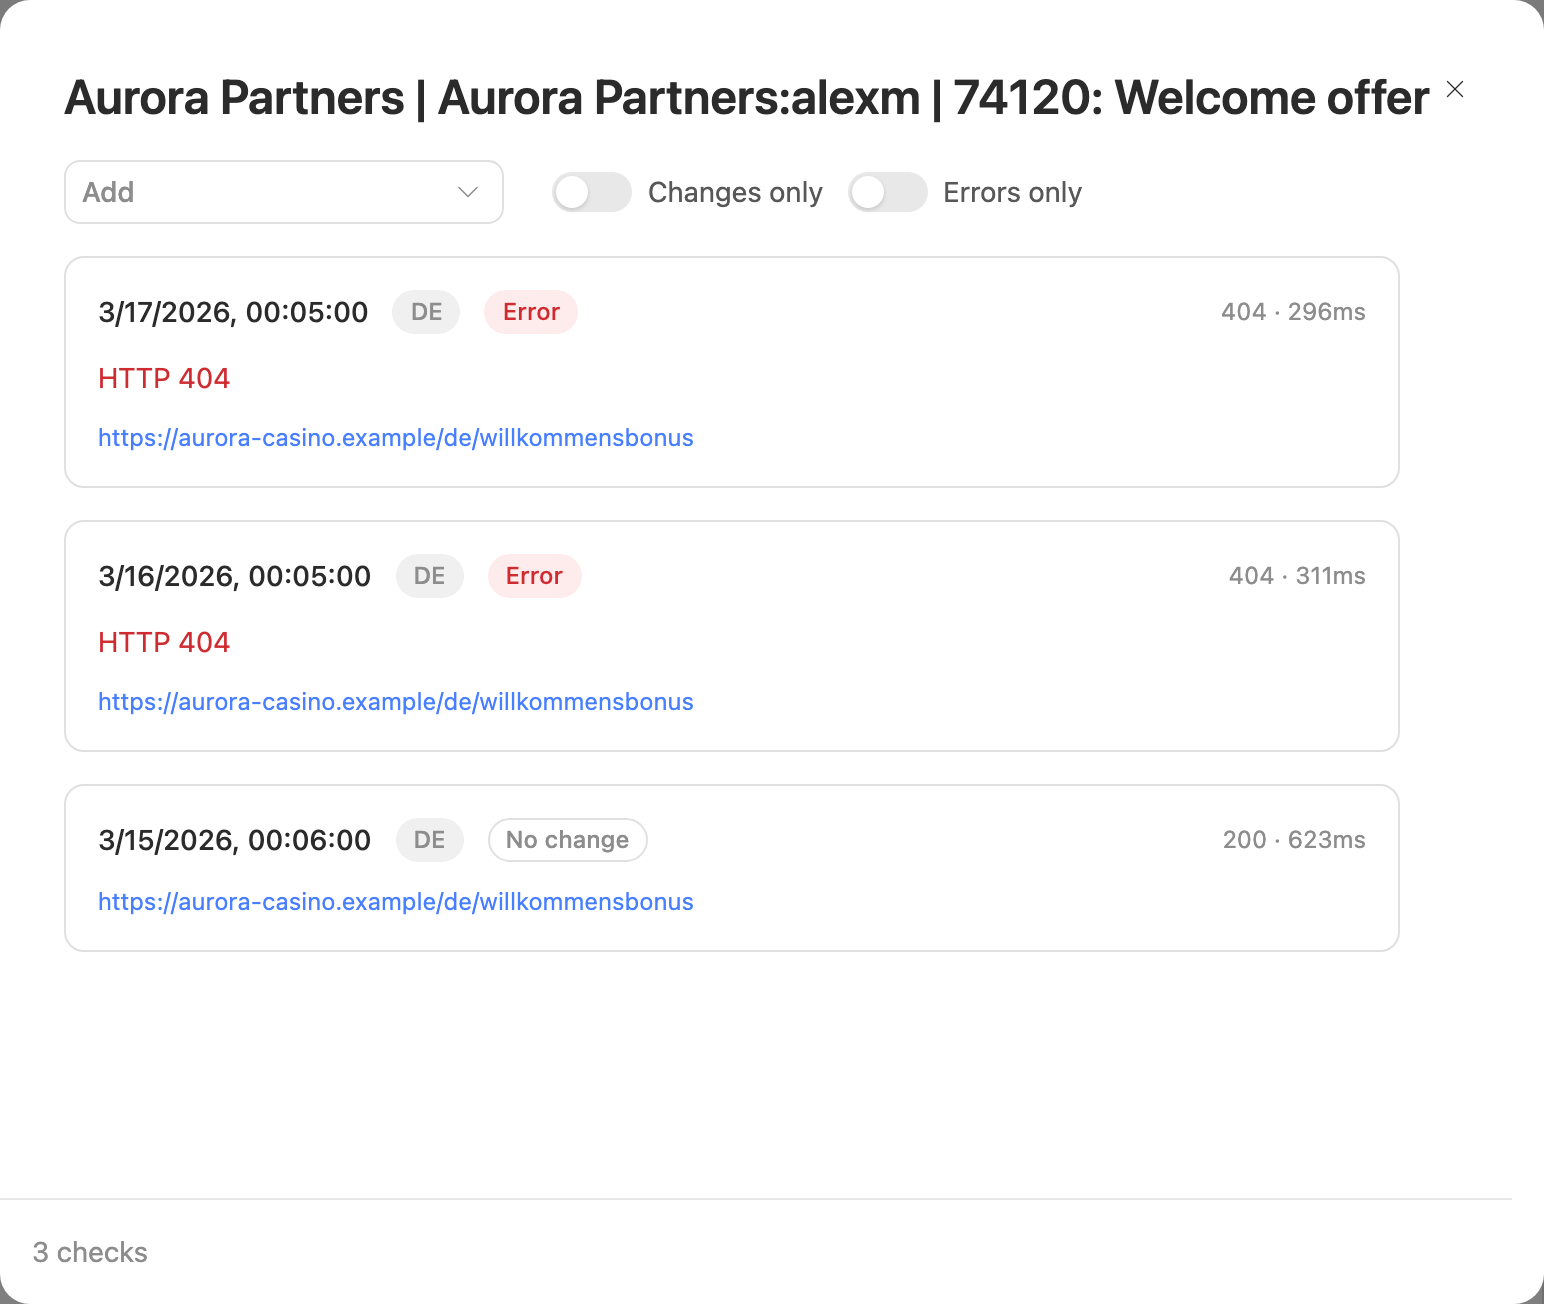
A check counts as a failure when:
- the page returns an HTTP error — 404, 500, and so on;
- the site blocks the check, usually by serving an anti-bot challenge page instead of the real content; or
- the page can't be reached at all — a timeout, a refused connection, a domain that no longer resolves.
When that happens, three things follow.
- The monitor's status changes to Error, Blocked or Unreachable, so the link stands out on this screen.
- Routy raises an issue against the link — Link Not Found for a 404, Link Blocked when the site blocked the check, Link Error otherwise — and notifies you: an in-app alert, an email, and a Slack message if you've connected Slack. A 404 is treated as critical; the rest are warnings.
- Repeats don't pile up. While the problem persists, the same issue is re-detected rather than raised again, so a link failing every day for a week is one notification, not seven. And because the issue is filed against the link rather than the monitor, three countries failing on the same link is one issue, not three.
What clears it
- A successful check. Once any monitor on that link comes back healthy, Routy resolves the link's open issues by itself, usually within about fifteen minutes. You don't have to close anything.
- Silence. If the problem simply stops being reported — you deleted the monitor, say — the issue closes on its own after a few hours.
Statuses
Blocked and Unreachable are both kinds of failure, separated out because they usually mean different things: Blocked is normally the destination site's protection reacting to an automated request, and often says nothing about whether the link works for real visitors, while Unreachable is more often a genuine outage.
Managing a monitor
The ⋮ menu on each monitor row holds everything else:
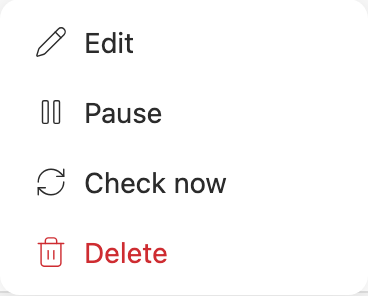
- Edit — change the name, description, or the country this monitor checks from.
- Pause / Resume — stop and restart checking. Pause is offered while a monitor is Active, Resume while it's Paused.
- Check now — run a check immediately instead of waiting for the schedule. Not available while a monitor is still Pending sync.
- Delete — stop monitoring this link from this location, for good.
Your monitor limit
Your plan includes a number of active monitors. Pausing one frees a slot; deleting one frees a slot; every other status — Active, Pending sync, Error, Blocked, Unreachable — uses one.
Once you're at the limit, Add monitor is disabled and tells you so on hover, and resuming a paused monitor is refused until you make room. Pause or delete something you care less about, or change your plan. Remember that each country is its own monitor: watching one link from five countries uses five of your slots.
Common questions
- A monitor has been "Pending sync" for a while. New monitors normally start checking within about fifteen minutes. If one is still pending well past that, contact support.
- The history has no screenshots. Snapshots are captured on the checks where a change was actually detected, and capture can occasionally fail. Checks with no change have no screenshot by design.
- A screenshot or View DOM link doesn't open. Those links are short-lived. Close the history and reopen it to get fresh ones.
- A monitor says Blocked but the link works fine in my browser. That's the destination site's bot protection reacting to an automated request, not necessarily a broken link. Open the link yourself from the same country to confirm before you act on it.
- One country is failing and the others are fine. That's usually real: the offer has been pulled or geo-restricted in that market. Check the failing monitor's history for the status code the page returned.
- I got no alert but the history shows a change. Look at the magnitude score. Small, cosmetic changes are recorded without notifying you.
When to contact support
Get in touch if a monitor stays in Pending sync for a long time, if it repeatedly errors on a link that loads perfectly in your browser from the same country, or if it never records any checks at all. Include the monitor name and the location it checks from.